Revisions to Australian GDP Forecasts
– Banyan Tree Research
In managing portfolio positions during the ongoing pandemic (which now has seen the delta variant outbreak and more than half of the Australian population under stay-at-home orders), monitoring macro indicators to gain early insights as to the economic consequences is ever more crucial.
In Figure 2, we highlight updated and revised consensus forecasts. In our view, whilst we expect the current coronavirus concern to be reduced over the next 3 months as vaccination rates increase; in the interim, the quantum of the economic impact will be determined by the success, length and strictness of the lockdowns going forward. Indeed, consensus now expects GDP to increase +0.4% QoQ, rather than +0.9% earlier projected, and the economy to contract despite a modest expansion in 2Q 2021. Further, on our estimates, the lockdowns should have between 0.7-1.5% points off GDP growth for 3Q 2021 (however this depends on the success in curbing the spread of the virus and ending lockdown).
Further, in the past week, retail sales data released from the Australian Bureau of Statistics (ABS) showed lockdowns (resulting in reduced mobility) across Australia’s two largest cities depressed sales in June, with extended restrictions expected to drag on sales in coming months. Retail sales fell -1.8% in June 2021 versus expectations of a -0.7% decline; this follows a rise of +0.4% in May 2021. We discuss.
Revisions to Consensus Forecasts for Key Australian Macro Indicators…
According to a Bloomberg survey of 36 economists conducted from July 15 to July 20, the Australian economy will expand +5.0% in 2021, +3.2% in 2022 and +3.0% in 2023. (Reproduced in Figure 2).
The key highlights to adjustments made to consensus forecasts (from Figure 1):
- 2Q 2021 GDP forecast remains unchanged at +0.8% QoQ. 3Q 2021 GDP forecast reduced to +0.4% QoQ versus prior forecast at +0.9%.
- 2021 CPI forecast increased to +2.1% YoY versus prior consensus forecast at +2.0%. 2022 CPI forecast increased to +2.0% YoY versus prior consensus forecast at +1.8%.
- RBA Central Bank Rate is expected to remain at 0.10% by end-4Q21 (current rate is 0.10%).
Retail sales slump as expected…
The key data highlights reflect retail sales patterns mirroring lockdown enforcement:
- retail sales fell -1.8% in June 2021 versus expectations of a -0.7% decline and follows a rise of +0.4% in May 2021.
- on a state-by-state basis, Victoria (-3.5% MoM), New South Wales (-2.0%) and Queensland (-1.5%) led the falls, with both states implementing stay-at-home orders for part of the month. Victoria’s fall this month is greater than the decline observed in May when the state-initiated Stage 4 Covid-19 restrictions.
- as expected, Food retailing (+1.5%) was the only industry to see an increase in June, driven by states entering or in lockdown in the month. Consistent with previous lockdowns, the largest falls observed were for cafes, restaurants and takeaway food services, and clothing, footwear, and personal accessory retailing. Retailers also pushed their efforts back to online distribution channels.
- interesting, through-the-year sales remain positive, up +2.9% relative to the previous corresponding period. compared to June 2020.
- in our view, retail sales are likely to continue to be disappointing in July given extended lockdowns in New South Wales, and the reintroduction of restrictions in Victoria and South Australia.
Figure 1: Global Markets Overview
Source: Banyantree, Bloomberg, Factset, Refinitiv; Pricing COB 26/07/21
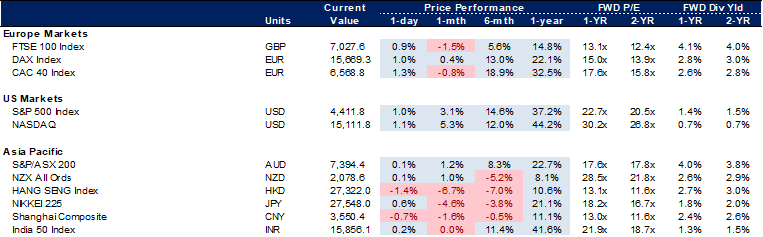
Figure 2: Revised Consensus Forecasts for Key Australian Macro- Indicators
Source: Banyantree, Bloomberg, Factset, Refinitiv
| 2Q | 3Q | 4Q | 1Q | 2Q | 3Q | 4Q | Avg. | Avg. | Avg. | |
| 2021 | 2021 | 2021 | 2022 | 2022 | 2022 | 2022 | 2021 | 2022 | 2023 | |
| GDP YOY% | 9.40% | 6.30% | 4.00% | 3.20% | 3.40% | 3.80% | 3.30% | 5.00% | 3.20% | 3.00% |
| Previous survey | 9.50% | 6.60% | 4.30% | 3.30% | 3.40% | 3.30% | 3.10% | 5.00% | 3.20% | 3.00% |
| GDP QOQ% | 0.80% | 0.40% | 1.20% | 1.00% | 0.80% | 0.80% | 0.80% | n/a | n/a | n/a |
| Previous survey | 0.80% | 0.90% | 0.90% | 0.90% | 0.80% | 0.80% | 0.80% | n/a | n/a | n/a |
| Household Cons. YOY% | 14.70% | 7.10% | 3.60% | 3.30% | 2.90% | 3.70% | 3.00% | 6.30% | 3.20% | 3.10% |
| Previous survey | 15.10% | 7.60% | 3.90% | 3.50% | 3.50% | 3.20% | 3.00% | 6.50% | 3.40% | 3.10% |
| Govt. Cons. YOY% | 2.50% | 1.70% | 1.50% | 2.60% | 2.50% | 3.10% | 3.10% | 2.80% | 2.50% | 1.80% |
| Previous survey | 2.50% | 1.60% | 1.30% | 2.50% | 2.00% | 2.70% | 2.80% | 2.70% | 2.50% | 2.00% |
| GFCF YOY% | 9.90% | 11.10% | 8.50% | 4.40% | 3.90% | 4.00% | 3.80% | 8.40% | 4.10% | 2.90% |
| Previous survey | 10.20% | 11.30% | 9.40% | 5.10% | 4.40% | 4.10% | 3.50% | 8.70% | 4.40% | 2.90% |
| Exports YOY% | 3.20% | 7.80% | 4.70% | 5.30% | 4.80% | 4.90% | 4.20% | 2.40% | 5.30% | 4.10% |
| Previous survey | 3.20% | 7.80% | 4.60% | 5.20% | 5.10% | 4.70% | 4.20% | 2.40% | 5.20% | 4.10% |
| Imports YOY% | 17.20% | 13.70% | 9.30% | 6.80% | 6.60% | 5.80% | 4.90% | 10.10% | 6.50% | 4.00% |
| Previous survey | 17.40% | 13.60% | 8.50% | 6.30% | 6.40% | 4.90% | 5.10% | 10.00% | 6.20% | 6.60% |
| CPI YOY% | 3.50% | 2.40% | 2.00% | 1.90% | 1.90% | 1.90% | 2.00% | 2.10% | 2.00% | 2.20% |
| Previous survey | 3.40% | 2.40% | 1.80% | 1.80% | 1.80% | 1.80% | 2.00% | 2.00% | 1.80% | 2.20% |
| Wage Price Index YOY% | 1.80% | 2.30% | 2.30% | 2.30% | 2.40% | 2.60% | 2.70% | 2.00% | 2.60% | 3.00% |
| Previous survey | 1.80% | 2.20% | 2.10% | 2.10% | 2.20% | 2.40% | 2.50% | 1.90% | 2.40% | 2.90% |
| Unemployment rate | n/a | 5.00% | 4.80% | 4.70% | 4.60% | 4.50% | 4.30% | 5.20% | 4.60% | 4.20% |
| Previous survey | 5.30% | 5.10% | 4.90% | 4.80% | 4.70% | 4.70% | 4.70% | 5.40% | 4.70% | 4.20% |
| Current Acct. % GDP | 3.70% | 3.50% | 3.40% | 3.30% | 2.90% | 2.80% | 2.60% | 3.00% | 2.10% | 1.00% |
| Previous survey | 3.50% | 2.70% | 3.10% | 2.90% | 2.60% | 2.30% | 2.40% | 2.80% | 1.50% | 1.00% |
| Budget as a % GDP | n/a | n/a | n/a | n/a | n/a | n/a | n/a | -7.80% | -5.00% | n/a |
| Previous survey | n/a | n/a | n/a | n/a | n/a | n/a | n/a | -7.70% | -4.80% | n/a |
| 3Q | 4Q | 1Q | 2Q | 3Q | 4Q | 1Q | 2Q | 3Q | 4Q | |
| 2021 | 2021 | 2022 | 2022 | 2022 | 2022 | 2023 | 2023 | 2023 | 2023 | |
| Central Bank Rate | 0.10% | 0.10% | 0.10% | 0.10% | 0.10% | 0.10% | 0.10% | 0.10% | 0.25% | 0.50% |
| Previous survey | 0.10% | 0.10% | 0.10% | 0.10% | 0.10% | 0.10% | 0.10% | 0.10% | 0.10% | n/a |
| 3-month Interbank | 0.06% | 0.08% | 0.08% | 0.10% | n/a | n/a | n/a | n/a | n/a | n/a |
| Previous survey | 0.04% | 0.05% | 0.05% | 0.05% | 0.05% | 0.10% | n/a | n/a | n/a | n/a |
| 2-Year Note | 0.10% | 0.10% | 0.10% | n/a | n/a | n/a | n/a | n/a | n/a | n/a |
| Previous survey | 0.10% | 0.11% | 0.11% | 0.12% | 0.12% | 0.12% | n/a | n/a | n/a | n/a |
| 3-Year Note | 0.40% | 0.43% | 0.50% | 0.55% | 0.75% | 0.90% | n/a | 1.10% | n/a | 1.25% |
| Previous survey | 0.40% | 0.43% | 0.48% | 0.50% | 0.55% | 0.60% | n/a | n/a | n/a | n/a |
| 10-Year Bond | 1.75% | 1.90% | 1.95% | 2.00% | 2.05% | 2.18% | 2.03% | 2.23% | 2.25% | 2.28% |
| Previous survey | 1.93% | 2.00% | 2.03% | 2.09% | 2.20% | 2.25% | 2.25% | 2.25% | 2.25% | n/a |